| Colocation 2004 Executive Summary |
 |
|
| |
Over the past three years, prices for most telecom services have
plummeted dramatically, some by as much as 90 percent. However, prices for
colocation have remained relatively stable. Moreover, the negative gap
between expenses and revenues has narrowed appreciably on some colo
providers' income statements, as many facilities are now profitable. What
explains this success?
The secret, paradoxically, lies in failure. While bankruptcy in most
telecom industries reduced the number of suppliers but not necessarily the
supply, consolidation in the colocation sector has done both. Many providers
have shelved ambitious construction plans; others have exited the market
entirely, converting facilities to warehouses and other non-telecom uses.
With the colocation supply thus constrained, fill rates in the remaining
facilities have inched encouragingly upward.
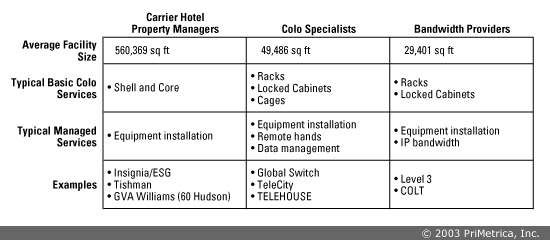
Colocation facilities occupy a crucial position in the telecommunications
landscape, serving as the juncture for a diverse array of network providers,
ISPs, content providers, and enterprises. In a sense, each colocation
facility is defined by its combination of tenants. Consequently, colo
providers are diverse, both in terms of the characteristics of their
facilities and the range of services offered. Even so, the colocation
providers profiled in this report may be grouped into three general
categories: bandwidth providers offering colocation within their PoPs, real
estate and investment companies providing basic space within carrier hotels,
and colo specialists focusing heavily on colocation and hosting services
(see Figure 1. Colocation Provider Typology).
At their most basic, colocation facilities offer customers housing for
equipment, though many also offer the requisite systems—redundant power, air
conditioning, and security—for establishing a point of presence (PoP)
quickly and easily. Typical colocation customers include carriers, ISPs,
and, increasingly, private enterprises. Large corporations often opt to
locate equipment in third-party sites, as the sheer magnitude and
mission-critical nature of their data and networking needs may overwhelm
internal resources.
Services
Colocation space is sold in a variety of configurations: racks, cabinets,
cages, suites, vaults, and shell-and-core space (leased by the square foot
or square meter). In addition, most colocation providers offer basic managed
services such as installation and low-level maintenance (e.g., rebooting
computers). Some colo operators—particularly bandwidth providers— also offer
connections to the outside world, including SDH or SONET circuits, Ethernet,
optical wavelengths, and dark fiber. Most facilities also include Internet
transit among their service offerings. Colo providers serving smaller
enterprise customers offer more advanced services, including equipment
monitoring, web hosting and load balancing, switch partitioning, and data
storage, backup and disaster recovery.
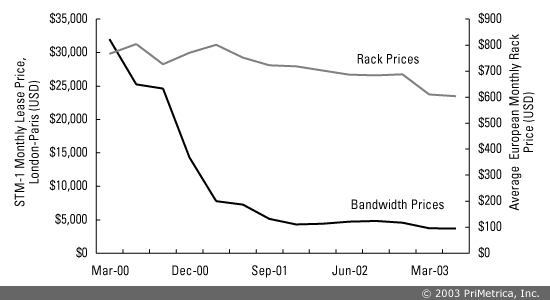
Pricing
Pricing for colocation services has remained relatively stable compared
to many telecom services. European rack prices in the cities surveyed
averaged approximately $600 per month during the first half of 2003 while
U.S. prices averaged $900 per month during the same time frame. These
average prices mask the fact that prices can vary sharply, not just between
these regions, but within individual metropolitan markets. The average rack
price in European colocation facilities has dropped 25 percent since March
2000. In contrast, a 155 Mbps London-Paris STM-1 circuit lease in summer
2003 sold for only one-tenth of March 2000 prices (see Figure 2. European
Bandwidth versus Rack Prices, 2000-2003).
Two factors help explain why colocation prices have resisted the
precipitous erosion that has plagued services in other telecom sectors.
First, the cost structure of colocation services is quite different from
that of bandwidth services. Technological advances such as Dense Wavelength
Division Multiplexing (DWDM), which enables carriers to send more than 100
wavelengths down a single strand of fiber, have driven down the cost of
providing a circuit. By contrast, the two key cost inputs for colocation
services—real estate and electricity—have remained firm.
Effective market consolidation represents a second factor supporting
colocation prices. As with many telecom sectors, rapid expansion during the
boom of the late 1990s and 2000 resulted in chronic oversupply for the
colocation sector. Oversupply led to the insolvency of several providers,
including Colo.com, Verado, and CityReach. In other sectors of the telecom
industry (and in most industries that produce non-perishable goods),
"consolidation" has signified a reduction in the number of players, with
assets simply shifting from one player to another, rather than a reduction
in assets supplied. Thus, while a bankrupt fiber-optic network operator may
liquidate its assets, its deployed fiber does not disappear but remains
buried—and, thus, potentially available for future use. Industry
consolidation in this sense may reduce the supply and demand gap for
provisioned services but rarely addresses the long-term supply overhang of
potential services.
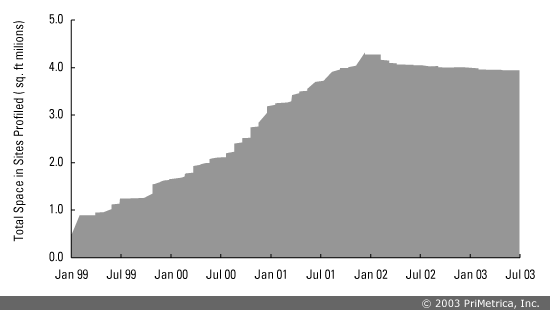
In the colocation sector, however, consolidation has had longer-lasting
effects on the level of supply. Unlike fiber and similar telecom assets, a
company can convert buildings for use in other industries. A warehouse
remodeled for use as a data center in the mid-1990s, for example, can be
reconverted for use as a warehouse. As a result, colo industry consolidation
has removed assets from the pool of supply, resulting in a true reduction of
space in some cities (see Figure 3. Total Space in U.S. Colo Specialist
Facilities, 1999-2003).
A variety of mechanisms has removed real and potential supply from the
colocation market:
- Ambitious build-out plans were scrapped. An inventory of planned
facilities suggests the total would have exceeded tens of millions of
square feet. Had every planned conversion and construction taken place,
the total floor space in major U.S. cities would have exceed today’s
supply by 50 percent or even 100 percent.
- Colocation spaces were reconverted for use in other industries. For
example, Tishman recast a 442,000 square foot department store
distribution building in Washington, D.C. as the Union Station Telecom
Center. The building proved commercially unviable as a carrier hotel, and
by mid-year 2002, Tishman was exploring conversion of the building to
government agency offices.
- Colocation centers were sold to private, non-telecom enterprises. In
three separate transactions, MCI sold three colocation centers to Wachovia
bank, Citigroup, and DST Systems, a computer software services company.
Signs of Success
As of mid-year 2003, many colocation providers were still struggling
against the widespread supply overhang. Equinix, Terremark, Redbus
Interhouse, and TeleCity each reported negative EBITDA for the year 2002.
Nevertheless, income statements from colo providers revealed that
cost-cutting efforts were bearing fruit:
- As of mid-year 2003, Redbus Interhouse operated three EBITDA-positive
facilities. Operating loss in first-half 2003 for the company overall had
narrowed to roughly one-half of the 2002 loss.
- Both TELEHOUSE America and TELEHOUSE Europe reported EBITDA-positive
results over the past several years.
- Interxion reported 350 percent revenue growth in 2002 over the
previous year and claimed to operate “a number of cash-flow positive
buildings.”
- Six of nine TeleCity facilities were EBITDA positive by year-end 2002.
- Switch and Data reported it was EBITDA positive in 2002.
In the sixteen cities profiled for this report, colo providers had sold
roughly 60 percent of the 45 million square feet of floor space available.
Annual revenues from services provided in these facilities totalled
approximately $1.1 to $1.7 billion.
Despite many prominent bankruptcies, service providers in certain telecom
sectors have little to show for their pain. Particularly for providers of
long-distance networks, the supply overhang remains vast and prices soft.
For many of the survivors of the colocation real estate bust, the view from
2003 is decidedly less grim. Market mechanisms have had some effect:
business failures have resulted in a true reduction in the aggregate volume
of colocation space, improving the balance between supply and demand.
A Look Forward
The first section of Colocation provides an overview of the entire colo
industry. The analysis includes a review of colocation provider
developments, examination of colocation infrastructure, and an investigation
of services and pricing trends. The remaining pages of Colocation offer
profiles of individual colo facilities. Organized by city, each of the 404
profiles provides contact and address information; data on total and
available space; details on power provisioning, security measures, fire
suppression, and climate control configuration; a list of bandwidth
providers connected to the facility; and a review of the services (basic and
managed) on offer at the facility. A metro-level map of the site's location
accompanies each profile. |