 |
Òåëåêîì â Ðîññèè 1992-2004 |
|
|
home | î ïðîåêòå | êîíòàêòû | ïîèñê |
|
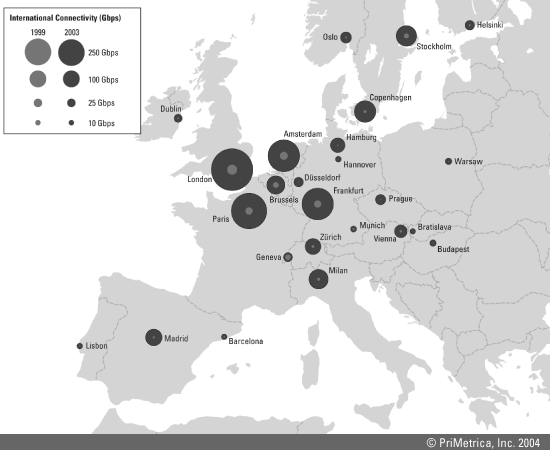
Terrestrial Networks, the second volume of International Bandwidth, profiles over 100 terrestrial network operators in Europe and the Americas, and provides a comprehensive overview of long-haul network supply, demand and pricing. Submarine Networks, the companion volume to this report, provides similar analysis of undersea fiber-optic systems. The initial chapters of this report offer a basic overview of bandwidth products, contracts, technologies, and costs to provide context for understanding how that supply is bought, sold, and produced. Next, the volume quantifies the supply of fiber-based capacity—both current and potential—and explores the effect bankruptcies have had on the field of providers. The report then examines the demand side of the equation, charting current demand growth and the factors determining factors. A thorough review of pricing trends concludes the analysis. Supply & Demand In the last ten years, new fiber-optic technologies coincided with a frenzy of network construction to multiply the supply of lit bandwidth between many European and North American cities by over a thousand-fold. The anticipated demand boom that would fill these new circuits and wavelengths, however, hardly materialized. The resulting glut of unsold inventory depressed capacity prices to 10 percent or less of the value envisioned in the (pre-bust) business plans of many network providers. Facing a mountainous overhang of unsold bandwidth, sellers may hope that demand for bandwidth catches up to supply, or at least that industry consolidation reduces supply levels. Data suggest that neither hope will be fulfilled within the next several years. Scenario 1: Increase Demand. Bandwidth providers may take comfort in some encouraging signals. Despite the market downturn, demand for capacity has remained robust. International network usage from London, for example, surged from 34 Gbps in 1999 to 620 Gbps in 2003 (see Figure 1. Map of International Circuit Usage by City, 1999 & 2003). Burgeoning Internet traffic has driven the majority of recent bandwidth purchases. After dipping in 2002, the pace of new capacity deployments for use in Internet backbones re-accelerated in 2003.
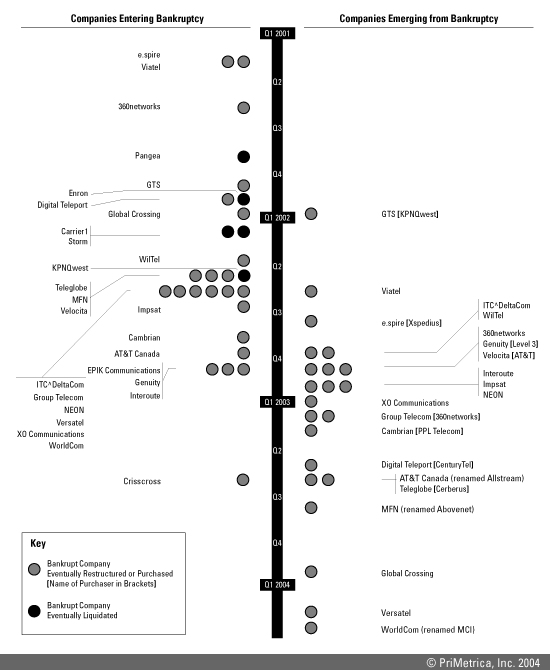
Despite such gains, quantities of purchased bandwidth pale in comparison to both current (lit) and potential supply. For example, 10.2 Tbps of lit capacity passes through Frankfurt, yet the sum of international bandwidth from Frankfurt used for Internet, voice, and other networks totals only 357 Gbps—not even 5 percent of lit supply. Inventories of potential capacity are even more astounding. The town of Helena, Montana (population 26,000), for example, has access to a potential (lit plus unlit) 113 Tbps of bandwidth. At mid-year 2003, total Internet bandwidth to all U.S. homes totaled only 29.2 Tbps—26 percent of the potential capacity passing through tiny Helena. Because companies can light dark wavelengths and fiber with relative ease, providers cannot discount latent bandwidth as merely hypothetical. Scenario 2: Reduce Supply. Falling prices and slower-than-anticipated demand have driven over two dozen bandwidth providers into bankruptcy since 2000, yet major industry consolidation has not occurred. Only a handful of bankruptcies resulted in outright liquidation; most companies emerged from bankruptcy after a restructuring period (see the timeline in Figure 2. Bankruptcy Timeline). With prices for fiber and other network assets fetching so little on the open market, most creditors have elected to resurrect bandwidth service providers rather than liquidate their network. Even when bandwidth providers have been forced into liquidation, their network has invariably been acquired by a rival company, usually for pennies on the dollar.
As a result of the deliberate pace of market consolidation, quantities of bandwidth and fiber have not changed significantly in last three years. Most major cities in Europe and the U.S. are connected to multiple terabits of unsold lit capacity (see Figure 3. European and U.S. Network Supply, 2003: Providers, Fiber Count, and Bandwidth). As of early 2004, supply overshadowed demand to such a degree that a supply-side solution to the supply/demand imbalance would require that over 75 percent of existing bandwidth providers cease operations entirely—and that the market survivors refrain from purchasing the stranded network assets.
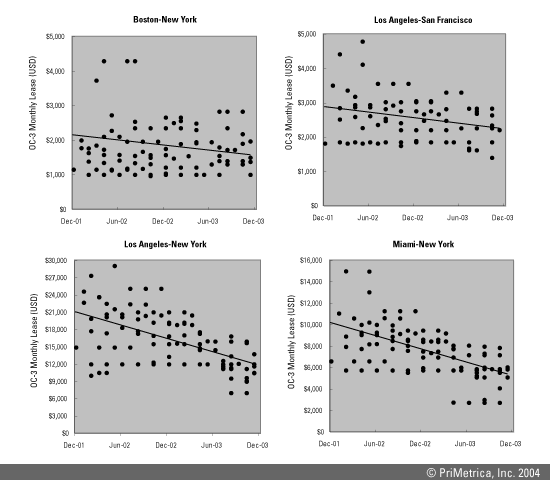
Prices & Outlook The severe supply/demand mismatch has caused capacity prices to collapse. In the past five years, OC-3 lease prices on major U.S. routes have plunged by 85 percent to more than 90 percent, cumulatively. The rate of price erosion abated somewhat in 2002, with annual decreases on most U.S. routes averaging a relatively modest five to 15 percent. This respite proved to be short-lived: price cuts picked up speed again in 2003, with prices on most routes dropping by 10 percent to more than 30 percent (see Figure 4. OC-3 Lease Prices on Major U.S. Routes, Q1 2002-Q4 2003). As was the case in the U.S., European price declines abated slightly in 2002, only to gather speed again in 2003. After falling five to 15 percent in 2002, European circuit prices dropped by 15 to 35 percent in 2003. Price erosion has taken on a momentum of its own, as buyers have come to expect steady price reductions, and sellers have become accustomed to meeting buyers’ aggressive target prices. In early 2004, TeleGeography conducted a survey of bandwidth providers to determine how they expected to adjust their prices in the coming year. Responses were surprisingly varied. Some carriers expected to keep prices unchanged, while others projected price cuts of up to 40 percent. In practice, these differences may be less significant than they appear. Companies expecting to make deep price cuts were usually relatively high-priced providers, while some of the most fiercely competitive carriers expected declines of ten percent or less. On balance, carriers’ responses suggest that prices would fall 14 and 16 percent on terrestrial routes in the U.S. and Europe, respectively. Whether carriers’ expectations are an accurate predictor of market trends remains to be seen. However, given that bandwidth providers already expect to cut prices by approximately 15 percent, it would be surprising if prices fell less, given that aggressive buyers will certainly demand deeper reductions. Carriers’ views on future prices reveal an underlying tenet of market expectations: any market must be comprised of both buyers and sellers, and market expectations are a reflection of the views of both parties. After more than half a decade of rapid price erosion, there is now a real danger that market expectations are becoming a self-fulfilling prophecy.
|
|||||||||||||||||||||||||||||||||||||||||||||||||||||||||||||||||||||||||||||||||||||||||||||||||||||||||||||||||||||||||||||||||||||||||||||||||||||||||||||||||||||||||||||||||||||||||||||||||||||||||||
|
|
|
|||||||||||||||||||||||||||||||||||||||||||||||||||||||||||||||||||||||||||||||||||||||||||||||||||||||||||||||||||||||||||||||||||||||||||||||||||||||||||||||||||||||||||||||||||||||||||||||||||||||||||
|
design by kondrashov.ru (C) 2001 Alexey Kondrashov | ||||||||||||||||||||||||||||||||||||||||||||||||||||||||||||||||||||||||||||||||||||||||||||||||||||||||||||||||||||||||||||||||||||||||||||||||||||||||||||||||||||||||||||||||||||||||||||||||||||||||||||


