
 |
| 1. |
AT&T
Corp. |
United
States |
12,006.8 |
9,680.1 |
24.0% |
52.6 |
4.6 |
| 2. |
WorldCom |
United
States |
11,454.7 |
12,399.5 |
-7.6% |
35.2 |
1.7 |
| 3. |
Sprint |
United
States |
5,384.4 |
3,922.8 |
37.3% |
26.1 |
0.8 |
| 4. |
Deutsche
Telekom |
Germany |
5,025.1 |
4,525.0 |
11.1% |
43.3 |
0.7 |
| 5. |
France
Telecom |
France |
4,592.0 |
4,393.0 |
4.5% |
38.6 |
1.0 |
 |
| 6. |
BT* |
United
Kingdom |
4,233.5 |
4,559.3 |
-7.1% |
26.6 |
n.a. |
| 7. |
Cable
& Wireless |
United
Kingdom |
3,113.8 |
3,487.6 |
-10.7% |
3.1 |
n.a. |
| 8. |
Telefónica |
Spain |
3,084.8 |
2,656.9 |
16.1% |
27.6 |
2.8 |
| 9. |
Telecom
Italia |
Italy |
3,042.0 |
2,706.0 |
12.4% |
28.0 |
n.a. |
| 10. |
China
Telecom |
China |
2,600.0 |
2,240.0 |
16.1% |
14.5 |
n.a. |
|
* Data are for the fiscal year
ending March 31, 2002. Telecom New Zealand’s fiscal year ends June
30, 2002.
Notes: Traffic figures are for
public switched telephone network (PSTN) circuits and International
Simple Resale only (service resale is excluded). Carrier rankings
based on originating country minutes only; when based on the
aggregated traffic of all subsidiaries, the top multinational
carriers include: AT&T, BT, WorldCom, Cable & Wireless,
Teleglobe, and Primus. International service revenues generally
reflect net of PSTN service revenues after adding or subtracting for
settlement payments but may also include some private line revenue.
All revenue figures converted from original currency at conversion
rate current to year end reported.
Source: TeleGeography research,
FCC, and company reports.
Notes: Figures include all
carriers authorized to provide international facilities-based
service or international simple resale (ISR).
Source: TeleGeography research
Notes: Voice-over-IP (VoIP)
traffic includes all cross-border voice calls carried on IP networks
but terminated on public switched telephone networks; PC-to-PC
communications and private network traffic are excluded. PSTN
traffic includes circuit-switched voice and fax traffic carried on
traditional international facilities as well as international simple
resale (ISR) facilities. Figures for 2002 are estimated.
Source: TeleGeography research
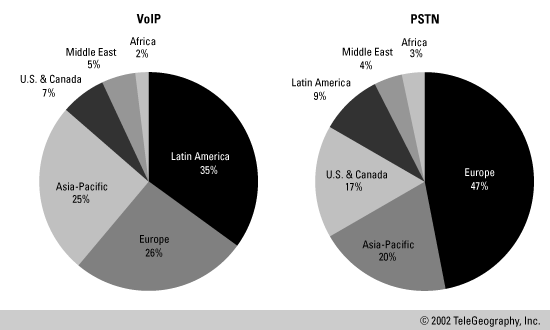
Notes: Voice-over-IP (VoIP)
traffic includes all cross-border voice calls carried on IP networks
but terminated on public switched telephone networks; PC-to-PC
communications and private network traffic are excluded. PSTN
traffic includes circuit-switched voice and fax traffic carried on
traditional international facilities as well as international simple
resale (ISR) facilities.
Source: TeleGeography research
II.Internet
| 2001 Rank |
2000 Rank |
City |
Country |
Countries
Connected |
International
Internet Bandwidth (Mbps) |
Interregional
Share |
| 1 |
1 |
London |
U.K. |
61 |
237,389.2 |
36.0% |
| 2 |
3 |
Paris |
France |
48 |
179,064.8 |
12.6% |
| 3 |
4 |
New York |
U.S. |
71 |
173,098.6 |
86.7% |
| 4 |
2 |
Amsterdam |
Netherlands |
27 |
170,371.8 |
14.4% |
| 5 |
5 |
Frankfurt |
Germany |
28 |
160,459.0 |
5.8% |
| 6 |
6 |
Brussels |
Belgium |
17 |
76,246.4 |
1.0% |
| 7 |
7 |
Stockholm |
Sweden |
18 |
60,349.0 |
2.3% |
| 8 |
20 |
Copenhagen |
Denmark |
13 |
43,456.0 |
24.0% |
| 9 |
17 |
Milan |
Italy |
15 |
29,701.8 |
4.4% |
| 10 |
9 |
Toronto |
Canada |
6 |
24,942.3 |
0.1% |
|
Note: Figures represent
Internet bandwidth connected across international borders to each
Consolidated Metropolitan Statistical Areas or equivalent. Domestic
routes are omitted. Data as of mid-2001.
Source: TeleGeography research
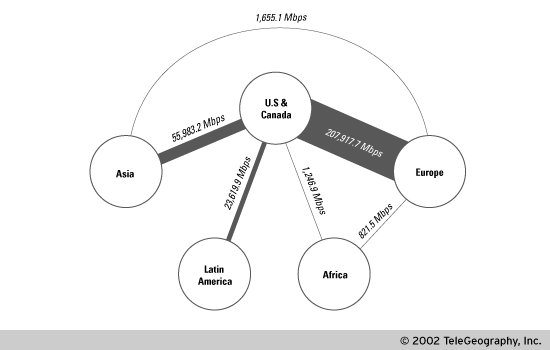
Notes: Figure represents
Internet bandwidth connected across international borders. Data as
of mid-2002.
Source: TeleGeography research
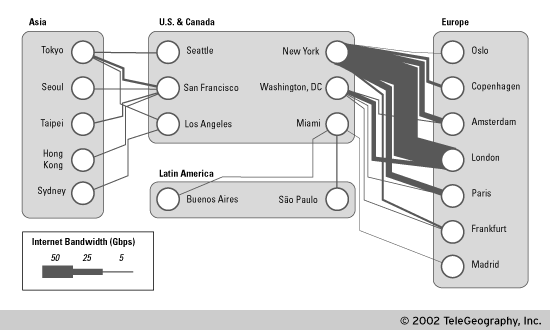
Notes: Figure represents
Internet bandwidth connected across international borders to
Consolidated Metropolitan Statistical Areas or equivalents.
Intraregional and domestic routes are omitted. Data as of mid-2002.
Source: TeleGeography research
Notes: Map includes the top 30
domestic U.S. Internet routes ranked by aggregate bandwidth
connecting Consolidated Metropolitan Statistical Areas or
equivalents as of May 2002.
Sources: TeleGeography research
| Country |
Bit-Minute
Index, 2001 |
| Albania |
0.02 |
| Algeria |
n.a. |
| Andorra |
0.81 |
| Angola |
0.06 |
| Antigua
& Barbuda |
n.a. |
| Argentina |
5.08 |
| Armenia |
0.10 |
| Aruba |
0.03 |
| Australia |
2.09 |
| Austria |
7.68 |
| Azerbaijan |
0.06 |
| Bahamas |
0.27 |
| Bahrain |
0.06 |
| Bangladesh |
0.09 |
| Barbados |
0.22 |
| Belarus |
0.16 |
| Belgium |
27.05 |
| Belize |
n.a. |
| Benin |
0.07 |
| Bhutan |
n.a. |
| Bolivia |
0.61 |
| Botswana |
n.a. |
| Brazil |
4.29 |
| Brunei |
1.46 |
| Bulgaria |
0.64 |
| Burkina
Faso |
0.07 |
| Burundi |
0.34 |
| Cambodia |
0.07 |
| Cameroon |
0.09 |
| Canada |
5.39 |
| Cape
Verde |
0.07 |
| Chad |
0.18 |
| Chile |
3.28 |
| China |
0.85 |
| Colombia |
0.56 |
| Comoros |
0.23 |
| Congo,
Dem. Rep. |
n.a. |
| Costa
Rica |
0.26 |
| Côte
d'Ivoire |
0.04 |
| Croatia |
0.33 |
| Cuba |
0.02 |
| Cyprus |
0.25 |
| Czech
Republic |
14.05 |
| Denmark |
29.32 |
| Dominica |
n.a. |
| Dominican
Republic |
0.05 |
| Ecuador |
0.40 |
| Egypt |
0.38 |
| El
Salvador |
0.22 |
| Eritrea |
0.01 |
| Estonia |
3.24 |
| Ethiopia |
0.03 |
| Fiji |
0.12 |
| Finland |
9.22 |
| France |
22.43 |
| Gabon |
0.07 |
| Gambia |
n.a. |
| Georgia |
0.03 |
| Germany |
16.50 |
| Ghana |
0.04 |
| Greece |
0.79 |
| Greenland |
5.49 |
| Grenada |
n.a. |
| Guatemala |
0.77 |
| Guinea |
0.35 |
| Guinea-Bissau |
n.a. |
| Guyana |
0.07 |
| Honduras |
n.a. |
| Hong
Kong |
1.60 |
| Hungary |
4.15 |
| Iceland |
1.78 |
| India |
0.67 |
| Indonesia |
0.49 |
| Iran |
0.11 |
| Ireland |
2.07 |
| Israel |
n.a. |
| Italy |
6.42 |
| Jamaica |
0.18 |
| Japan |
5.84 |
| Jordan |
0.22 |
| Kazakhstan |
0.07 |
| Kenya |
0.19 |
| Korea,
Rep. |
3.36 |
| Kuwait |
0.20 |
| Kyrgyzstan |
0.15 |
| Laos |
0.35 |
| Latvia |
1.80 |
| Lebanon |
0.05 |
| Lesotho |
n.a. |
| Libya |
n.a. |
| Lithuania |
n.a. |
| Luxembourg |
2.20 |
| Macau |
0.38 |
| Macedonia |
0.05 |
| Madagascar |
0.29 |
| Malawi |
n.a. |
| Malaysia |
0.57 |
| Maldives |
0.60 |
| Mali |
n.a. |
| Malta |
0.87 |
| Mauritania |
0.07 |
| Mauritius |
0.18 |
| Mexico |
0.59 |
| Moldova |
0.20 |
| Mongolia |
0.62 |
| Morocco |
0.21 |
| Mozambique |
0.04 |
| Myanmar |
0.01 |
| Namibia |
0.06 |
| Nepal |
0.48 |
| Netherlands |
40.27 |
| Netherlands
Antilles |
0.44 |
| New
Zealand |
1.52 |
| Nicaragua |
0.38 |
| Niger |
0.08 |
| Nigeria |
n.a. |
| Norway |
22.68 |
| Oman |
0.16 |
| Pakistan |
0.28 |
| Panama |
0.75 |
| Papua
New Guinea |
0.79 |
| Paraguay |
0.28 |
| Peru |
1.06 |
| Philippines |
0.45 |
| Poland |
1.32 |
| Portugal |
2.74 |
| Qatar |
0.22 |
| Réunion |
n.a. |
| Romania |
2.89 |
| Russia |
2.10 |
| Rwanda |
0.07 |
| Saint
Lucia |
n.a. |
| Saudi
Arabia |
0.15 |
| Senegal |
0.32 |
| Seychelles |
n.a. |
| Sierra
Leone |
n.a. |
| Singapore |
1.04 |
| Slovak
Republic |
18.36 |
| Slovenia |
2.34 |
| South
Africa |
0.59 |
| Spain |
6.56 |
| Sri
Lanka |
0.17 |
| St.
Kitts & Nevis |
n.a. |
| Sudan |
0.03 |
| Suriname |
0.30 |
| Swaziland |
0.02 |
| Sweden |
22.11 |
| Switzerland |
9.00 |
| Syria |
0.01 |
| Taiwan |
2.95 |
| Tajikistan |
0.10 |
| Tanzania |
0.26 |
| Thailand |
1.01 |
| Togo |
0.07 |
| Trinidad
& Tobago |
0.22 |
| Tunisia |
n.a. |
| Turkey |
0.47 |
| Turkmenistan |
0.09 |
| Uganda |
0.35 |
| Ukraine |
0.30 |
| United
Arab Emirates |
0.35 |
| United
Kingdom |
14.01 |
| United
States |
6.80 |
| Uruguay |
2.10 |
| Uzbekistan |
0.01 |
| Venezuela |
0.91 |
| Vietnam |
0.33 |
| Yemen |
n.a. |
| Yugoslavia |
0.04 |
| Zambia |
0.10 |
| Zimbabwe |
0.06 |
|
Note: The Bit-Minute Index
expresses the relationship between international Internet supply and
demand, taking international telephone traffic as a proxy for demand.
Source: Telegeography research
III. Networks
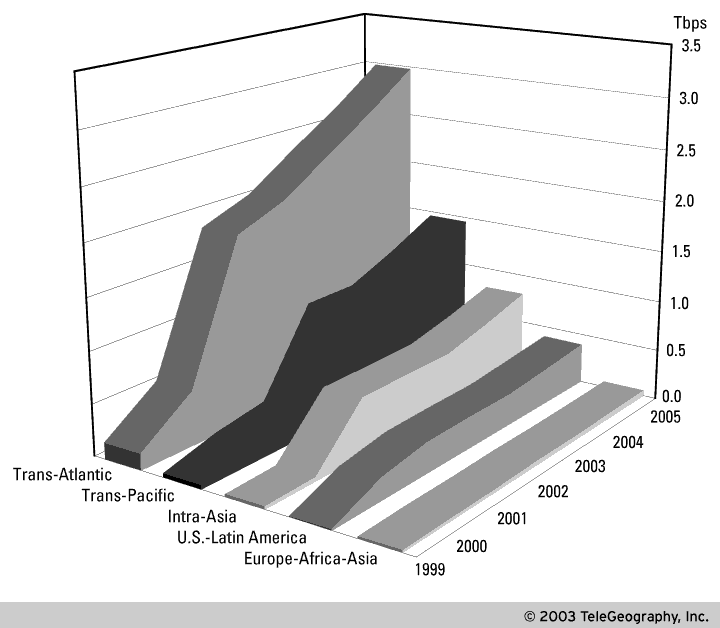
Notes: Capacity figures denote
lit, protected capacity at the end of the respective year. Projected
capacity assumes cables with upgradeable capacity will increase
total cable capacity 20 percent each year until fully upgradeable
capacity is achieved. Intra-Asia capacity includes cables with
landings in both Hong Kong and Japan. Trans-Pacific capacity
excludes Southern Cross and PacRim East. Trans-Atlantic capacity
excludes Atlantis-2. Cables retired prior to year-end 2003 excluded
from Fully Upgraded capacity.
Source: TeleGeography research
| |
1998 |
1999 |
2000 |
2001 |
2002 |
2003 |
2004 |
Fully
Upgraded |
| Intra-Asia |
16.1 |
41.1 |
66.1 |
826.1 |
1,106.1 |
3,637.1 |
6,440.1 |
30,591.1 |
| Trans-Atlantic |
83.0 |
168.0 |
537.4 |
1,862.4 |
2,682.4 |
3,729.1 |
4,775.8 |
12,322.4 |
| Trans-Pacific |
14.1 |
44.1 |
204.1 |
344.1 |
1,314.1 |
1,896.1 |
2,388.1 |
6,984.1 |
| U.S.-Latin
America |
10.6 |
13.1 |
250.6 |
275.6 |
275.6 |
725.6 |
1,171.1 |
4,915.6 |
| Europe-Africa-Asia |
11.1 |
31.1 |
51.1 |
51.1 |
61.1 |
71.1 |
81.1 |
171.1 |
|
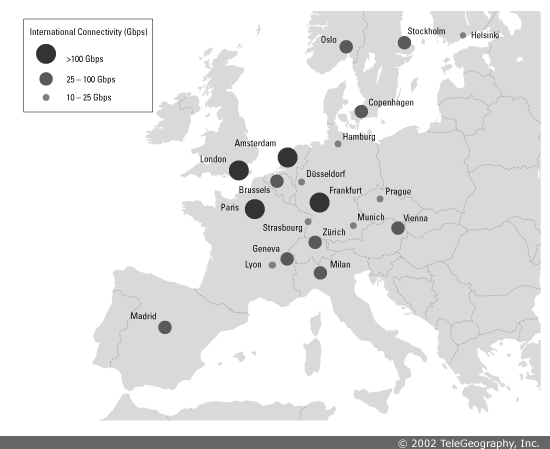
Note: See the "Demand"
chapter in Terrestrial
Bandwidth 2002 for detailed breakdown of city international
circuit usage by Internet, voice, and other network bandwidth.
Source: TeleGeography research
IV.Pricing
Notes: Points
represent prices quoted in the first quarter of 2002.
Source:
TeleGeography research
|
